
When building energy efficient homes you add temperature and humidity insulating layers to the outside walls.
Recently I needed to display a heat map for a cross section of an insulated wall.
On this rectangular cross section I have a number of temperature measurement points and want to show the temperature distribution across the rectangle, interpolating between the measurement points. I chose pure blue to represent the lowest temperature, pure red for the highest and a mixture of blue and red for intermediate temperatures.
So I know the temperature at some points and can translate it to a color value. For every point in my cross section I now have to interpolate these color values in two dimensions.
On every modern computing platform from smartphones to workstations there already exists a piece of hardware which is designed to do exactly this kind of interpolation, called a graphics processing unit. So why not try to use it to generate the diagram I wanted!
I came up with the following solution. Pass in the coordinates of the measurement points as vertices to the vertex shader. Then let the vertex shader program determine a color value for each vertex and pass it on to the fragment shader which will render every pixel on the screen. This worked beautifully for a couple of test points with hard-coded color values. But how to supply all the different temperature values to the shader program? You can pass outside values to the shader through uniform variables, but there’s a limit of at most a couple of hundreds of values it has room for.
On the other hand the shader can handle tens of thousands of vertices. And since I want to render a plane diagram I only need two of the three space coordinates of the points in the diagram, the third coordinate being the same for all points. This means I can use the z-coordinate of each point to pass a measurement value! In the vertex shader I then fetch the z-coordinate of each vertex, translate it to a color value and replace it by zero for rendering. The calculated color value is passed to the fragment shader in a varying variable and we’re done.
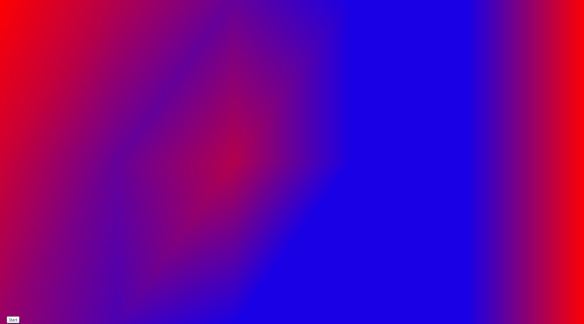
Heatmap for a coarse 3 x 5 grid
In my implementation I pass another two parameters to the shader: a maximum measurement value and a cutoff value for showing regions with a temperature higher than the cutoff in yellow. The maximum measurement value is needed to normalize measurement values to the range [0; 1]. This is needed for the measurement to color conversion because color coordinates are in this range.
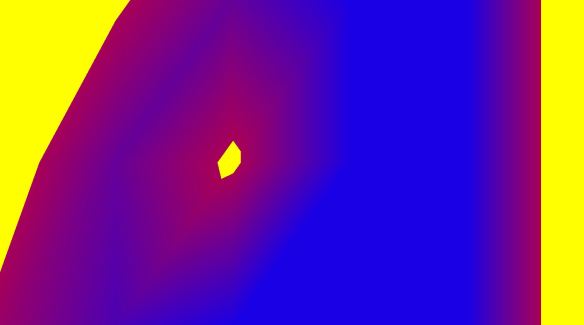
Heatmap with color cutoff at 35° C
Here’s a demo program using SceneJS to render the diagram in webGL in the browser (full code in my github):
    // Point SceneJS to the bundled plugins
    SceneJS.setConfigs({
//        pluginPath: "http://scenejs.org/api/latest/plugins"
			pluginPath:"./plugins"
    });

/*	simple test case 3x5 grid */
	var N_geometry1 =
		{
			type:"geometry/kbb_measurementGrid",
			id: "geometry1",
			width: 2,
			height: 2,
			widthSegments: 4,
			heightSegments: 2
		};

	// Define a 3x5 grid of temperature values
	var maxMeasurement;
	var measurement = new Array(3);
	for (var i=0; i<measurement.length; i++){
		measurement[i] = new Array(3);
	}

	measurement[0][0] = 30;
	measurement[0][1] = 15;
	measurement[0][2] = 05;
	measurement[0][3] = 05;
	measurement[0][4] = 05;
	measurement[1][0] = 40;
	measurement[1][1] = 20;
	measurement[1][2] = 35;
	measurement[1][3] = 05;
	measurement[1][4] = 05;
	measurement[2][0] = 50;
	measurement[2][1] = 35;
	measurement[2][2] = 20;
	measurement[2][3] = 05;
	measurement[2][4] = 05;

	// flatten measurement to a single array:
	var zValues = measurement.reduce(function(a, b) {
		return a.concat(b);
	});

	N_geometry1.zValues = zValues;

	var N_shader1 = {
		// Custom shader
		// interpret z-coordinates as color indicators and set to 0 for rendering.
		type: "shader",
		shaders: [
			{
				stage: "vertex",
				code: [
					"attribute vec3 SCENEJS_aVertex;",
					"varying vec3 outColor;",
					"uniform float maxMeasurement;",
					"varying float max;",
					"void main () {",
					"	 float measurement;",
					"	 measurement = SCENEJS_aVertex.z;",
					"    gl_Position = vec4(SCENEJS_aVertex.x, SCENEJS_aVertex.y, 0, 1.0);",
					"	 outColor = vec3((measurement/maxMeasurement),0.0,1.0-(measurement/maxMeasurement));",
					"	 max = maxMeasurement;",
					"}"
					]
			},
			{
				stage: "fragment",
				code: [
					"precision mediump float;",
					"varying vec3 outColor;",
					"uniform float cutoff;",
					"varying float max;",
					"void main( void ) {",
					// color cutoff at red=cutoff/maxMeasurement => yellow
					"gl_FragColor = vec4(outColor.r>cutoff/max ? vec3(1,1,0) : outColor, 1.0);",
					"}"
				]
			}
		],
		params: {
			// color cutoff at red=30/50 (30°C) => yellow (1.0 -> no highlighting, 0 -> everything highlighted)
			maxMeasurement: 50.,
			cutoff: 30.
		},
		nodes: [ N_geometry1 ]
	};

    var scene = SceneJS.createScene({
			type: "scene",
			canvasId: "canvas1",
			nodes: [N_shader1]
    });
}
For the geometry (the vertices I pass to the shader) I use a modified “geometry/plane” SceneJS plugin where I insert the measurement values as z-coordinates of the vertices.
