On Options and Option Tables
Options are contracts that give you the right to purchase or sell a specific stock at a guaranteed price independent of the current value of the stock. (There’s a good introduction to options here). You can view an option as a bet on the movement of a stock’s price. The option writer bets that the price will not reach the “strike price” of the option contract, if it does he loses money. As the buyer of an option you hope the stock price will surpass the strike price, the more it does the more profit you make.
Options come in two types: to buy stock at a specific price (call options) or to sell at a specific price (put options).
Of course you have to pay for an option. The more likely it is that the strike price will be reached the more expensive an option is. A call option with a strike price only slightly higher than the current price costs more than an option with a strike price double the current price (less likely to be reached). Also an option expiring to-morrow costs less than an option expiring in 30 days. If you lose the bet you lose exactly the amount you paid for the option, if you win your profit depends on how much the share price has passed the strike price, so it’s basically open-ended.
To find out about the available options for a stock you can go to a financial services site like Yahoo! Finance where you find option tables for most publicly traded stocks. Here is the option table for options for stock of VALE expiring in January 2017.

There’s a line for each option. When you try to compare them you have to consider at least the strike price, the strike date (when they will expire) and the premium or cost of the option. The strike date is embedded in the option symbol. You first have to extract this date, make a quick calculation how much time is still left, look at the strike price to determine how likely this is to be reached within the remaining time and, finally figure out whether the premium, i.e. cost of this option is favorable or not. Try to do that in your head for several options you’re trying to compare.
To help with this comparison I have written a little program (called a bookmarklet) to process the information from the option table in such a way that I can ask the question:
“If I buy this option today, how much profit do I make if the share price reaches x?”.
The answer to this question for each of the options in the table together with the number of days until expiration then gives me a basis to compare them in a meaningful way.
In the screenshot below, for instance, I entered two possible future share price scenarios: $8 and $20, respectively.
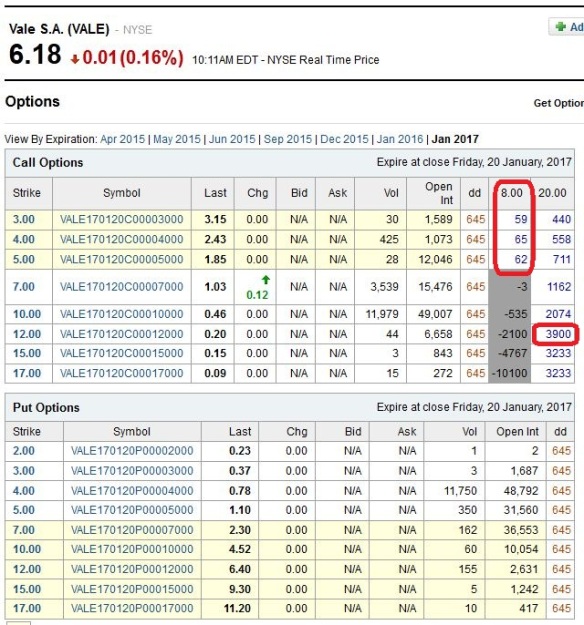
If the share price should reach $8 during the next 645 days only the call options with a strike price of $5 or less will give a profit (between 59% and 65%). The $7 option does not yield a profit, because it already costs more than a dollar, therefore if I exercise my option at a share price of $8, I would have paid $1.03 for the option + $7 per share = $8.03 which is more than the stock is currently worth ($8).
For the $20 share price scenario the $12 call option looks very attractive, yielding 3900% or 39 times my investment as profit. Of course, for a share price of $12 or less this option would be worthless and I would lose my investment.
Creating a Bookmarklet
A bookmarklet is formally a bookmark in a web browser like any other bookmark, but instead of pointing to a url it consists of a javascript program. When a bookmark is clicked the browser downloads the content from the bookmark’s url. When a bookmarklet is clicked the script in the bookmarklet is executed in the context of the currently loaded page.
This script can do anything in the browser that code downloaded from a url can do, in particular it can examine the current page, as well as modify its html, css and javascript. Most bookmarklets I have seen change the appearance of the current page (colors, fonts, etc.) or send content from the page to another url (to perform a search query or request a translation). Here I show a bookmarklet which examines (someone else’s) html tables and interactively adds new columns.
If you want to roll your own bookmarklet, here’s a good tutorial.
So, how exactly does my bookmarklet work? First I examined the Yahoo Finance page for the option chain of some stock. It shows two tables, one for call options, one for put options. Both tables (and only these) have the same class attribute “yfnc_datamodoutline1”. So
var tables_kbb =
   document.getElementsByClassName("yfnc_datamodoutline1");
retrieves the table elements from the document root and assigns it to a new variable. I give all the variable names I am using a specific suffix (“_kbb”) to make sure they don’t clash with the names of existing variables in the original html. From the table element I can access specific fields in the table through the html childNodes or children property. I use the children property which returns only child nodes which are elements, whereas childNodes would return text nodes as well.
The second column in the table lists the symbols or names of each option, from which I extract the strike date and calculate the number of days until expiration. I then show this number in a new column I add to the table.
For each row something like
		var col$_kbb = document.createElement("TD");
		table_kbb(table).children[row].appendChild(col$_kbb);
will add a new column to the row.
I then define a function setColumnValues_kbb(col) which will prompt for a stock price value and add a new column showing the expected profit one would make buying an option today if the stock should reach the price entered for that column before the strike date.
The following code allows triggering this function by key presses:
	document.onkeypress = function(event) {
		event = event || window.event;
		var code = event.keyCode || event.which;
		var keyString = String.fromCharCode(code);
		if (keyString == 'c') currentTable_kbb = 0;
		if (keyString == 'p') currentTable_kbb = 1;
		if (keyString == '1') setColumnValues_kbb(1);
		if (keyString == '2') setColumnValues_kbb(2);
		if (keyString == '3') setColumnValues_kbb(3);
		if (keyString == '4') setColumnValues_kbb(4);
		if (keyString == '5') setColumnValues_kbb(5);
	};
There’s a maximum of five columns which can be added by pressing the numeric keys, and the ‘c’ and ‘p’ keys switch between the call options and put options. Any column can be redefined with a new value.
Some Technical Considerations
During development I worked with local files to avoid having to upload each and every modification I made before being able to test it. When you load your script from file you can’t have it modify a live web page because of the same-origin security policy built into the browser. So I developed against a saved copy of the Yahoo Finance page. My script during development was loaded from a local html file like this:
<a href="javascript: (function () { var elem = document.createElement('script'); elem.setAttribute('src', 'file:///C:/E/Bookmarklets/file.js?t='+(new Date().getTime())); document.body.appendChild(elem); }()) ">

Bookmarklet (development)

</a>
The “javascript:” keyword in the href attribute tells the browser that the contents is a script and not a url.
The date/time stamp appended to the uri avoids working with a cached copy of the script.
Once I finished development I changed this to:
<a href="javascript: (function () { var elem = document.createElement('script'); elem.setAttribute('src', 'http://my-website.net/file.js'); document.body.appendChild(elem); }()) ">

Bookmarklet (production)

</a>
However, this did not work for the following reason: the Yahoo Finance page uses https protocol and my own web site http, so the browser blocks it with a “mixed active content” error message. I worked around this problem by avoiding to load my script from the web, including it completely in the bookmarklet instead:
<a href='javascript: (function(){var l=".kbb_percentage {color:#00a;
background-color:#fff;}";l+=".kbb_days {color:#a40;background-color:
#fff;}";var f=document.createElement("style");f.innerHTML=l;
document.body.appendChild(f);var p=document.getElementsByClassName("
yfnc_datamodoutline1");var a=0;alert("Klaus Yahoo Option Table Enhance
r\ntaking over!");d(0,8);d(1,8);document.onkeypress=function(t){t=t||
window.event;var s=t.keyCode||t.which;var r=String.fromCharCode(s);if(
r=="c"){a=0}if(r=="p"){a=1}if(r=="1"){o(1)}if(r=="2"){o(2)}if(r=="3"
){o(3)}if(r=="4"){o(4)}if(r=="5"){o(5)}};function o(r){var s=prompt
("Enter expected SP","");while(isNaN(Number(s))){s=prompt("Invalid
number!\nRe-enter expected SP","")}if(s!=null){n(a,0,r+8,s);h(a,r+8,s)
}}function q(t,s,u){var r=Number(g(s,u).innerHTML);console.log("# "+r+
" # "+e(s,u).innerHTML+" # "+s);if(s==0){return(100*(t-(Number(e(s,u)
.innerHTML)+r))/r).toFixed(0)}else{if(s==1){return(100*(Number(e(s,u)
.innerHTML)-(Number(t)+r))/r).toFixed(0)}else{return 0}}}function m()
{return document.getElementsByClassName("time_rtq_ticker")[0]
.children[0]}function j(r){myHTMLNode.innerHTML=r.innerHTML}function
i(r){return p[r].children[0].children[0].children[0].children[0].child
ren[0]}function e(r,s){return i(r).children[s].children[0].children[0]
.children[0]}function c(r,s){return i(r).children[s].children[1].child
ren[0]}function g(r,s){return i(r).children[s].children[2].children[0]
}function k(s,t){var r=document.createElement("TD");r.setAttribute
("class","yfnc_h");r.setAttribute("align","right");r.innerHTML="---";
i(s).children[t].appendChild(r)}function n(s,u,r,t){if(i(s).children
[u].childNodes.length0){i(s).children[u].children[r].setAttribute(
"class","kbb_percentage")}else{i(s).children[u].children[r].remove
Attribute("class")}}if(u==0){i(s).children[u].children[r].setAttribute
("class","yfnc_tablehead1")}}function h(t,r,s){for(var u=1;u<i(t)
.childNodes.length;u++){n(t,u,r,q(s,t,u))}}function d(s,r){n(s,0,r,"dd
");for(var t=1;t<i(s).childNodes.length;t++){n(s,t,r,b(s,t))}}
function b(u,v){var r;for(var t=0;t<6;t++){if(!isNaN(Number(r=c(u,v).
innerHTML.substring(t,t+6)))){var s=(new Date(Number(r.substring(0,2))
+2000,Number(r.substring(2,4))-1,Number(r.substring(4,6)))-new Date())
/(1000*60*60*24);console.log(s+" rounded: "+(s+0.5).toFixed(0));return
(s+0.5).toFixed(0)}}}}());'>Kyote 1.0</a>
If you look at it you’ll notice a couple of other things:
I replaced all my quotes by double quotes and put the complete script inside single quotes as the value of the href attribute.
I also got rid of all line breaks and comments. To achieve this I generated a minified version of my script using the YUI Compressor . This also had the side effect to reduce code size by replacing variable names by single letter names and removing most whitespace.
The anchor element above makes up the complete bookmarklet which can be dragged to your bookmarks and used from there on any Yahoo Finance option table.
You can find it here on my server if you want to try it out for yourself.